
AWS Cost Explorer Review
In-depth analysis of AWS Cost Explorer's features, user experiences, and optimization capabilities for managing cloud expenses effectively.
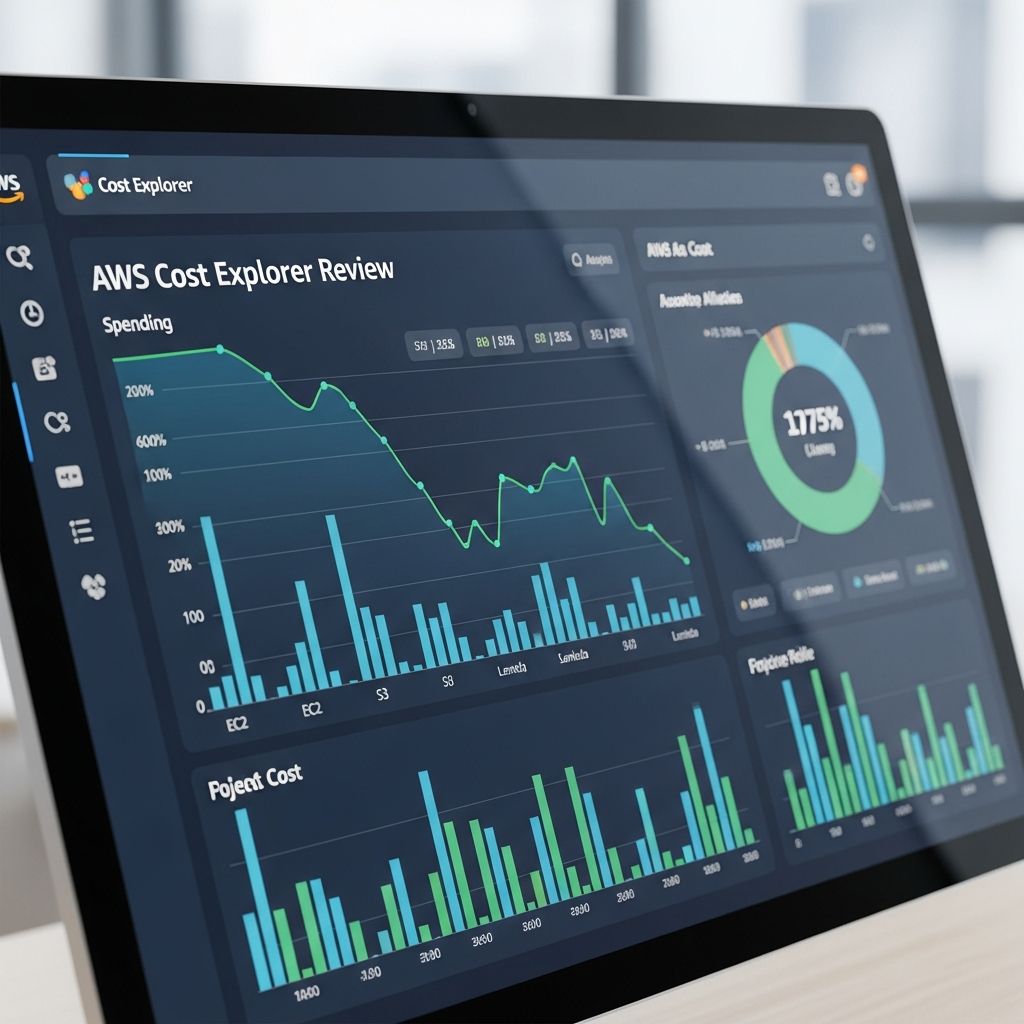
AWS Cost Explorer stands out as a vital tool in the arsenal of cloud financial management, empowering organizations to dissect their AWS spending patterns with precision. This service transforms raw billing data into actionable insights, helping teams from startups to enterprises curb unnecessary expenses and align budgets with actual usage. In this detailed review, we delve into its core functionalities, user feedback on performance, practical applications, and strategies for leveraging it alongside other AWS services.
Understanding the Foundations of AWS Cost Explorer
At its core, AWS Cost Explorer provides a graphical interface for exploring historical and projected costs across your AWS accounts. Users can access up to 13 months of past data shortly after activation, with forecasts extending 12 to 18 months into the future based on machine learning algorithms. This setup allows for quick identification of spending trends, such as spikes during peak workloads or gradual increases from underutilized resources.
The tool’s dashboard features interactive charts—line graphs for trends, stacked bars for service breakdowns, and pie charts for regional distributions—making it intuitive even for non-finance specialists. Data refreshes daily, ensuring timeliness, though initial processing for historical data may take a few days. Importantly, while the UI is free, API calls incur a nominal fee of $0.01 per request, suitable for automated reporting needs.
Key Capabilities That Drive User Satisfaction
Users consistently praise the depth of customization available. Filters let you slice data by service (e.g., EC2, S3), region, instance type, tags, or linked accounts, revealing hidden cost drivers. Grouping options aggregate expenses by custom dimensions like projects or departments, facilitating chargeback scenarios in multi-team environments.
- Visualization Power: Dynamic graphs support hourly granularity for recent data (up to 14 days), ideal for pinpointing diurnal usage peaks.
- Forecasting Precision: ML-driven predictions help in capacity planning, with accuracy improving as more data accumulates.
- Saved Reports: Pre-built templates for common analyses (e.g., top services, RI utilization) plus custom saves streamline recurring reviews.
- Resource-Level Insights: Track individual resource costs daily, aiding in rightsizing recommendations.
Recent enhancements, like the Cost Comparison feature, automate month-over-month variance analysis. The Top Trends widget on the Billing console highlights the biggest changes, linking directly to detailed Cost Explorer views for drill-downs.
User Experiences: Pros and Potential Drawbacks
Feedback from AWS practitioners highlights Cost Explorer’s role in achieving 20-30% savings through informed decisions. FinOps teams appreciate its no-setup complexity—enable via the console, and data populates automatically. One common win: identifying idle EC2 instances via hourly views, leading to shutdowns or spot instance migrations.
However, some users note limitations. Data latency (24+ hours for current month) can miss real-time anomalies, and the lack of disable option post-activation irks minimalists. Multi-year data requires explicit enabling, and while powerful, the interface can overwhelm novices without onboarding time.
| Feature | Strengths | User-Reported Challenges |
|---|---|---|
| Setup & Accessibility | One-click enablement; free UI access | Cannot disable; initial data delay |
| Filtering & Grouping | Highly granular; tag support | Learning curve for advanced combos |
| Forecasting | ML accuracy; 12-18 month horizon | Less reliable with erratic usage |
| Integration | API, Amazon Q, Budgets synergy | API costs for heavy automation |
Real-World Applications and Success Stories
In practice, a growing SaaS company used Cost Explorer to compare June vs. July bills, spotting a $65K Redshift surge from a new workload. Filters revealed unblended costs pre-discounts, guiding RI purchases that cut expenses by 40%. Another case: a startup analyzed EC2 doubling during app launches, preemptively scaling with Savings Plans.
For enterprises, payer vs. blended cost views clarify discount impacts across consolidated billing. Combined with AWS Budgets, it triggers alerts on anomalies, preventing budget overruns.
Integrating with Broader AWS Cost Optimization Ecosystem
Cost Explorer shines brightest alongside companions like AWS Cost Anomaly Detection and Compute Optimizer. Export reports to S3 for BI tools, or query via API for dashboards in QuickSight. Amazon Q in Cost Explorer now interprets natural language queries, auto-updating visuals—e.g., “Show EC2 costs by region last quarter.”
Best practices include:
- Tag resources consistently for attribution.
- Enable daily/hourly granularity early.
- Review Top Trends weekly.
- Pair with RI Recommendation reports.
Getting Started: Step-by-Step Activation
Navigate to the Billing and Cost Management console, select Cost Explorer, and click “Enable.” Within 24 hours, current data appears; full history follows. Explore the guided tour, customize your first report by service, and save for reuse. Programmatic access via API suits DevOps pipelines.
Advanced Tips for Maximum ROI
Pro users leverage resource-level views for micro-optimizations, like deleting unused EBS volumes. Hourly data unmasks bursty patterns, favoring Lambda over persistent instances. Forecast variances signal overcommitment, prompting spot market shifts. Track RI coverage to avoid on-demand premiums.
For global orgs, multi-account views via AWS Organizations consolidate insights, enforcing governance.
FAQ: Common Questions on AWS Cost Explorer
How long does data take to populate?
Current month: ~24 hours; historical: 2-3 days.
Is there a cost to use it?
UI free; API $0.01/request.
Can I access multi-year data?
Yes, enable for up to 38 months monthly granularity.
Does it support forecasting?
Yes, up to 18 months via ML.
How to handle linked accounts?
Filter by payer or linked account dimensions.
Final Verdict: Is AWS Cost Explorer Worth It?
Overwhelmingly, yes—for any AWS user beyond free tier. Its blend of accessibility, depth, and integration delivers tangible savings, often paying for itself in weeks. While not perfect for sub-hourly needs, it remains the gold standard for strategic cost governance. Activate today and unlock the visibility your cloud spend demands.
References
- Analyzing your costs and usage with AWS Cost Explorer — Amazon Web Services. 2023-10-01. https://docs.aws.amazon.com/cost-management/latest/userguide/ce-what-is.html
- AWS Cost Explorer — Amazon Web Services. 2026-01-15. https://aws.amazon.com/aws-cost-management/aws-cost-explorer/
- Quick MoM Cost Analysis with Cost Comparison in AWS Cost Explorer — AWS Cloud Financial Management Blog. 2024-08-20. https://aws.amazon.com/blogs/aws-cloud-financial-management/quick-mom-cost-analysis-with-aws-cost-explorers-new-cost-comparison-feature/
- Exploring more data for advanced cost analysis — Amazon Web Services. 2023-11-05. https://docs.aws.amazon.com/cost-management/latest/userguide/ce-advanced-cost-analysis.html
- AWS Cost Explorer: Optimize Cloud Spending — Amazon Web Services. 2023-05-10. https://aws.amazon.com/video/watch/8d8c75ad4bf/
Similar Articles






Read full bio of Sneha Tete